

Downgrade Lifestyle: Indonesia’s Real Economic Signal
What Is “Downgrade Lifestyle” and Why Is It Trending on Threads? Since early September 2026, the term “downgrade lifestyle” has…
-
binomedia
- October 9, 2026

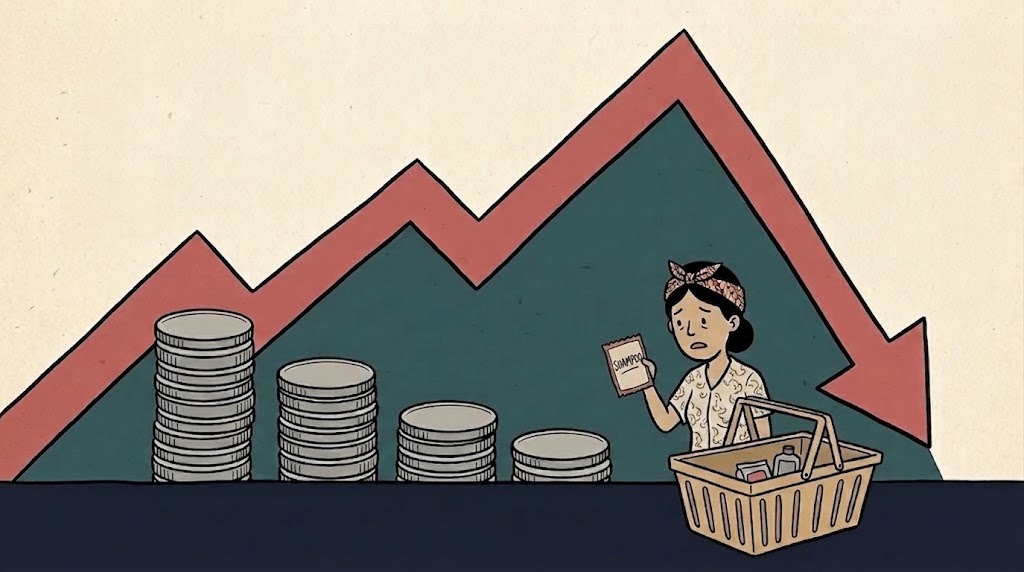
Indonesia’s gross domestic product (GDP) grew by 5.29 percent in the second quarter of 2026. This figure exceeded the median forecast of economists, which stood at around 5.1 percent. Annual inflation remained controlled at 2.88 percent, while economic growth throughout the first half of 2026 reached 5.45 percent. On paper, this economic performance should reflect a situation where consumers feel more confident and have greater flexibility in spending their income.
The reality observed from shopping shelves tells a different story. The phenomenon recently referred to as the sachet economy has become one of the clearest reflections of the gap between aggregate economic statistics and consumers’ everyday shopping experiences. The Bank Indonesia Consumer Survey for June 2026 recorded that the consumption to income ratio increased to 73 percent. Meanwhile, the savings ratio declined to 17 percent, compared with 17.5 percent in the previous month. The increasing share of income spent on daily consumption and the declining portion allocated for savings create a paradox where strong economic growth exists alongside weakening household financial reserves.
The sachet economy refers to a consumption pattern where people continue purchasing daily necessities but shift toward smaller packaging formats with more affordable prices. Consumers do not stop buying products. Instead, they purchase smaller quantities in each transaction. Products such as soap, shampoo, detergent, coffee, and cooking spices are shifting from bottles and larger packages into single use sachets priced from around one thousand rupiah to several thousand rupiah.

From a unit price perspective, sachet products are actually more expensive. One liter of shampoo purchased in a bottle can be two to three times more economical per milliliter compared with buying ten sachets from the same brand. Consumers who switch to sachets understand this difference, but they do not have enough available cash to pay for larger packages upfront.
As a result, consumers choose formats that can be purchased according to their immediate financial capacity, even though the total long term expenditure may become higher. This pattern is commonly referred to as down trading in Indonesia’s FMCG sector. Consumers are not leaving the market, but they are moving toward lower price segments.
This shift can be seen directly in traditional markets, small shops, and neighborhood stores. Retailers report that customers who previously purchased 200 ml shampoo bottles are now choosing sachet strips. Bulk detergent sales are declining and being replaced by individual sachets.
Data from the Brand Footprint 2026 report released by Worldpanel by Numerator illustrates this pattern clearly. Smaller brands now account for 41 percent of all monitored brands, increasing from 39 percent in the previous year. More than half of these smaller brands recorded growth.
The seasoning brand Desaku, for example, expanded its market reach through affordable sachet products. The diaper brand Baby Happy improved its competitiveness through more economical packaging formats and broader distribution across various sales channels.
Corina Fajriyani, Marketing Lead at Worldpanel Indonesia, explained in the report that sustainable brand growth depends on a company’s ability to understand consumer needs and maintain relevance in everyday life. In the context of purchasing power pressure, this relevance is increasingly measured through packaging size rather than product quality alone.
Brands that fail to provide affordable product formats risk losing consumers to smaller and more agile competitors. Packaging size, which was previously considered only a product variation, has now become a determining factor in whether a brand can maintain market relevance or lose its market reach.
The Kantar report also noted that consumers tend to seek better value by purchasing larger quantities per shopping visit while simultaneously shifting toward cheaper products. Shopping frequency has not increased, but basket size per visit has become larger as consumers maximize every available shopping opportunity.
This survival strategy does not indicate greater prosperity. Instead, it shows that consumers are calculating every rupiah more carefully than before.
The Brand Footprint 2026 report also shows that competition among brands is becoming increasingly intense. Out of 451 monitored brands, only 44 percent recorded growth throughout 2025, declining from 62 percent in the previous year. Venu Madhav, Managing Director of Worldpanel Indonesia, explained that consumers are still shopping regularly, but brands can no longer rely only on overall market growth. Winning new buyers has become more important than before. In this situation, brands that provide affordable sachet packaging gain a clear competitive advantage.
The sachet economy phenomenon does not exist independently. It is closely related to the shift in Indonesia’s population structure based on expenditure groups that has been taking place over the past s everal years.Data from the Central Statistics Agency (BPS) shows that Indonesia’s middle class population declined from 57.33 million people, representing 21.45 percent of the population, in 2019 to 47.85 million people, representing 17.13 percent, in 2024. Within five years, approximately 9.48 million people moved out of the middle class category.
Where did these people move? The group categorized by BPS as the “aspiring middle class” increased from 128.85 million people to around 137.5 million people. Meanwhile, the vulnerable poor group increased from 54.97 million people to 67.69 million people. These figures describe households that have not officially fallen into poverty. They may still own houses, vehicles, and continue providing education for their children. However, they have started reducing dining out expenses, postponing major purchases, and cutting savings in order to maintain their daily living standards. The decline in middle class purchasing power does not happen suddenly. Instead, it occurs gradually over time. Because the change happens slowly, this phenomenon can easily escape public attention.
The Central Statistics Agency (BPS) classifies the population into ten expenditure groups, known as deciles, based on per capita spending levels. Deciles 1 to 4 include poor and vulnerable poor groups. Decile 5 serves as a transition zone. Meanwhile, Deciles 6 to 10 are categorized as middle class groups and the highest expenditure groups. This classification is relative in nature. A person’s position within a specific decile is determined by comparison with the entire Indonesian population, rather than by an absolute measurement of their living standards.
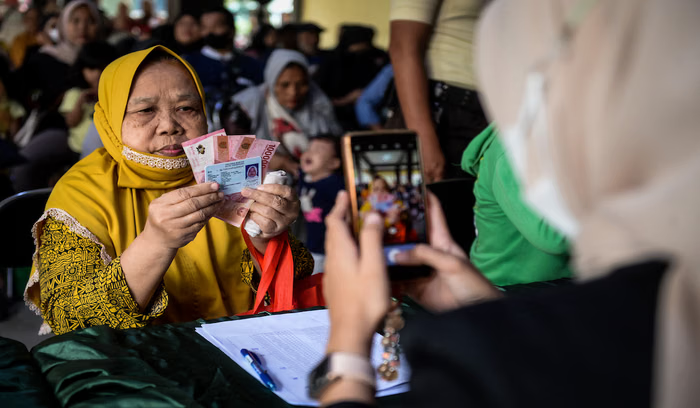
The decile framework has recently triggered public debate after the National Socio Economic Single Data became accessible online. Some citizens were surprised to discover that their status was recorded in Decile 9 or even Decile 10. They felt that their economic condition did not match the perception of being financially well off. For example, a family that still rents a house with a household income of around three million rupiah per month can be categorized in a higher decile. This happens because, compared with other communities facing greater economic vulnerability, their expenditure level is still considered relatively high. BPS has explained that decile positions are comparative measurements rather than direct indicators of whether someone experiences economic comfort. The classification shows a person’s relative position compared with other households, not necessarily their actual quality of life.
The public debate surrounding decile data essentially reveals another side of the same phenomenon represented by the sachet economy. The gap between a person’s statistical position and their everyday economic experience continues to widen. People who are officially categorized as financially adequate based on official data may have already been purchasing shampoo in sachets for years.
This shift has broad implications for the national economy. The middle class has historically served as a driver of consumption, a source of tax revenue, and an important contributor to education investment. When millions of people move from the middle class into the aspiring middle class category, their consumption patterns also change. They postpone purchasing new vehicles, switch to used vehicles, reduce recreational spending, and shift their daily product choices toward cheaper alternatives. When this transition occurs among millions of households at the same time, the change from expansionary consumption to defensive consumption can create pressure on several sectors, including retail, manufacturing, and property.
One reason the sachet economy phenomenon is easy to overlook is that consumer confidence indicators remain within what is technically considered an optimistic zone. The Bank Indonesia Consumer Confidence Index (CCI) in June 2026 stood at 117.8, declining from 120.9 in the previous month, but it remained above the threshold level of 100. A figure above 100 is often interpreted as an indication that household economic conditions remain relatively positive.
This interpretation is technically correct, but it does not provide a complete picture. When the CCI is examined alongside household income allocation data, a more complex situation emerges. In June 2026, the proportion of income allocated for consumption reached 73 percent, installment payments accounted for 10 percent, and savings represented 17 percent of income. One month later, in July 2026, the savings ratio declined further to 16.8 percent, while the proportion allocated for installment payments increased to 10.5 percent. The trend remained consistent from month to month: household room for saving continued to narrow, while debt obligations increased.
The pressure does not affect all groups equally. The same Bank Indonesia survey recorded a decline in perceptions regarding job availability across almost all education levels. Households with monthly expenditure between Rp2.1 million and Rp3 million experienced the sharpest decline in their savings ratio. The gap between economic growth and purchasing power is becoming increasingly visible. Macroeconomic figures may appear healthy, while household finances among certain expenditure groups continue to experience pressure.
The gradual decline in the Consumer Confidence Index from month to month can easily be interpreted as a normal fluctuation. However, when the decline occurs together with rising consumption ratios and decreasing savings over several consecutive months, it indicates more than a temporary movement. The situation reflects ongoing systemic pressure that develops slowly enough to avoid being captured by a single economic indicator.
The Consumer Expectation Index (CEI) remained at 126.4, higher than the Current Economic Condition Index (CECI), which stood at 109.2. This indicates that people still expect economic conditions to improve over the next six months. However, these expectations are not yet supported by concrete improvements in income composition. As long as the share of income spent on consumption and installment payments continues to rise while savings continue to decline, this optimism remains supported by a fragile foundation.
The gap between economic growth on paper and pressure experienced by consumers at shopping shelves is also reflected in how the media reports the 5.29 percent economic growth figure. What makes this interesting is that differences in framing do not only occur between different news organizations. Even within the same newsroom, the perspective can shift from optimistic to cautious within only a few days when discussing the same economic data.
Kompas.com published several headlines with different framings regarding the same economic figures in early August 2026. Some headlines directly questioned the paradox between economic growth and consumer purchasing power, such as: “Why Is the Economy Growing, but Purchasing Power Weakening?” and “Indonesia’s Economy Grows 5.29 Percent, Why Does Purchasing Power Still Feel Weak?” Other headlines focused on employment concerns: “Indonesia’s Economy Grows 5.29 Percent, Retail Slows and Layoff Risks Remain.” Another article highlighted concerns about the quality of economic growth: “Economic Growth of 5.29 Percent Remains Fragile, Dependent on Fiscal Support.”
However, the same media outlet also published headlines with a more reassuring perspective: “Indonesia’s Economy Grows 5.29 Percent, Purbaya and Airlangga Agree It Remains Strong.” This headline emphasized government officials’ optimism regarding the same economic figures.
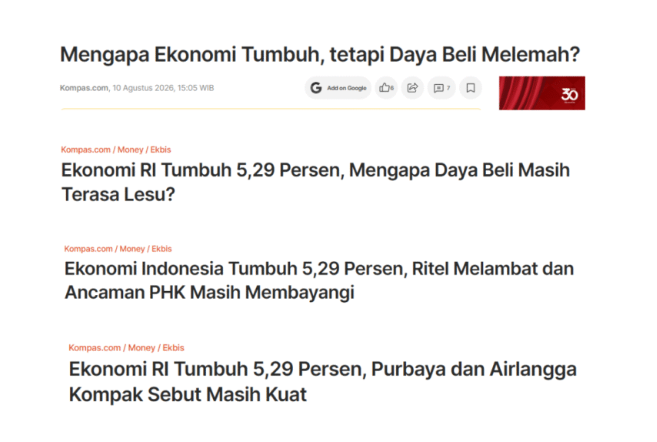
The differences in framing are also reflected in the sources quoted by the media. News reports that quoted Finance Minister Purbaya Yudhi Sadewa and Coordinating Minister for Economic Affairs Airlangga Hartarto tended to produce narratives emphasizing that economic foundations remained strong despite global pressures. Meanwhile, media reports that quoted independent economists such as Bank Permata Chief Economist Josua Pardede or Professor of Economics at Andalas University Syafruddin Karimi tended to highlight retail weakness, slowing household consumption, and the risk of layoffs.
This pattern demonstrates an important point for anyone working with media data. Simply counting how many media outlets report the 5.29 percent growth figure is not enough to understand how the issue is perceived by the public. News volume only answers the question of how widely an issue is discussed. It does not explain the direction in which the narrative is moving. Two readers who each see only one headline about the same event can reach completely different conclusions. One reader may feel confident that the economy is performing well, while another may become concerned about potential layoffs. Both readers are responding to reports based on the exact same official economic data. Framing, rather than volume, determines public perception.
The sachet economy phenomenon in Indonesia serves as a reminder that aggregate economic growth figures do not fully represent the economic experiences of every household. Strong GDP growth can occur alongside declining purchasing power among certain groups of society. From Indonesia’s 5.29 percent GDP growth in the second quarter of 2026, household consumption contributed 2.67 percentage points. Government consumption contributed 1.07 percentage points, while investment contributed 2.06 percentage points. This means the contribution of household spending to economic growth declined compared with the previous quarter, while government spending and investment helped fill the gap.
For businesses, the shift toward smaller packaging is not a temporary marketing strategy. This change represents a response to structural shifts in Indonesian consumers’ purchasing capacity, a transformation that has taken place over several years and has yet to show signs of reversal. Brands that understand this pressure and adjust their product formats have proven capable of maintaining growth, as shown by data from the Brand Footprint 2026 report. Brands that fail to adapt risk losing consumers to competitors that are more agile and offer more affordable alternatives.
For policymakers, the data behind the sachet economy phenomenon shows that strengthening the purchasing power of the middle class and vulnerable groups requires attention equal to the achievement of economic growth figures. A growing GDP and declining household savings are not two separate stories. They represent two different sides of the same economy, and examining only one side without considering the other creates an incomplete picture. For organizations that need to understand how a single economic issue is reported from multiple media perspectives, including identifying which media outlets lean toward optimistic narratives and which emphasize caution when discussing the same data, Newstensity is designed to support these needs.

What Is “Downgrade Lifestyle” and Why Is It Trending on Threads? Since early September 2026, the term “downgrade lifestyle” has…

binomedia

You can no longer tell AI astroturfing from genuine public opinion by reading the text. Generative AI writes as fluently…
binomedia

Who controls money in the blockchain era? When Bitcoin launched in 2008, the answer sounded simple: no single party, because…
binomedia

The debate over whether AI development should slow down is no longer theoretical. In September 2026, the CEOs of the…
binomedia

AI brand visibility is how often, how accurately, and in what context your brand appears in answers from AI-powered search…
binomedia

The DTSEN social assistance decile controversy in 2026 is not merely about inaccurate data. Media monitoring and digital conversation analysis…
binomedia

Artificial intelligence (AI) is transforming education faster than most education systems can respond. Machines can now search for information, summarize…
binomedia
One Event, Two Market Moves On Monday, August 10, 2026, Indonesia’s rupiah closed 0.79% higher at IDR 17,755 per US…
binomedia

On Thursday, July 30, 2026, Indonesian President Prabowo Subianto announced a “cleanest city” competition. The top five cities would win…
binomedia

Before dawn on Friday, 24 July 2026, a mob in Bali beat a man to death. He is identified only…
binomedia